stormcatchments (Python package)
There are many computational tools available to delineate watersheds. These tools generally can perform quite well when delineating large catchments (say, for an entire stream) or delineating smaller catchments in areas with limited development. One common drawback of these methods is that they tend to focus solely on topographic features and don’t integrate drainage infrastructure such as culverts or subsurface stormwater networks. In suburban or urban areas, storm drainage networks can have a significant impact on catchment delineation.
Some tools exist to incorporate stormwater networks into catchment delineation, but few (or none?) are free, open-source, and generally applicable. Esri’s ArcHydro has capabilities to incorporate stormwater networks into hydrologic analysis tools. ArcHydro is likely the most commonly used proprietary solution. USGS StreamStats is a great web-based tool for hydrologic analysis, and in select areas it also has the ability to incorporate stormwater networks into catchment delineation. One such area is St. Louis County, as described in their scientific report Missouri StreamStats—St. Louis County and the City of St. Louis Urban Application1.
I set out to write an open-source and generally applicable Python package that could help solve this problem and came up with stormcatchments. The crux of the problem that stormcatchments attempts to solve is the conversion of existing infrastructure datasets, sourced as standard point and line geospatial data, to directed graphs. These graphs are represented using a NetworkX DiGraph object. Graph traversal and other networking functions can then be applied to the stormwater network to incorporate flows which are directed independent of surface topography.

A simple directed graph (image from Wikipedia)
The actual watershed delineation work in stormcatchments is powered by pysheds, which has impressively quick implementations of common watershed delineation algorithms. Its speed can likely be attributed in part to its use of Numba. With the help of pysheds, delineating catchments to individual pour points is simple. What stormcatchments does is determine which additional pour points need to be added or removed to a catchment area due to subsurface infrastructure.
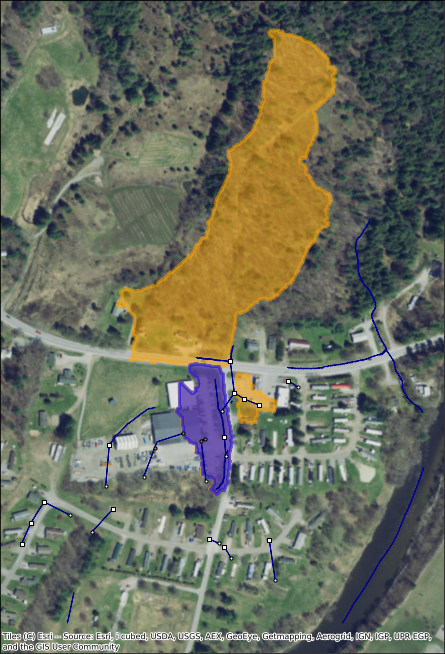
Delineation results from stormcatchments where the original catchment (infrastructure unaware) is plotted in blue, and the stormcatchment (infrastructure aware) is plotted in orange
You can view the stormcatchments project on GitHub here.
-
Southard, R.E., Haluska, T., Richards, J.M., Ellis, J.T., Dartiguenave, C., and Djokic, D., 2020, Missouri StreamStats—St. Louis County and the City of St. Louis urban application: U.S. Geological Survey Scientific Investigations Report 2020–5040, 27 p., https://doi.org/10.3133/sir20205040. ↩